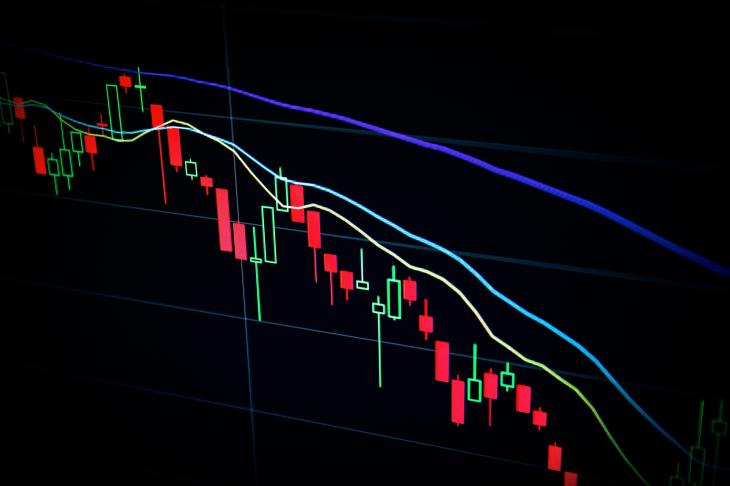
Trading stocks can be daunting for those just starting to dip their toe into the investing pool. However, understanding key indicators and mastering technical analysis is one the essential steps to becoming successful as a stock trader over the long term. To help you start your journey, this article will discuss some of the most common technical indicators traders use when analysing stocks and how they can help you make smarter investment decisions.
This article will guide you on whether you’re gearing up to buy or sell stocks immediately or stacking knowledge for future trading endeavours. Let’s take an exciting journey together to learn more about technical analysis –– let’s go.
What Are Technical Analysis Indicators?
Technical analysis indicators are used to evaluate the performance of a security and predict future price movements. These indicators can be anything from moving averages to more complex market studies such as Fibonacci retracements or Pivot Points. Those who utilise technical analysis believe that all publicly available security information is factored into its current price, indicating its future values from analysing this data.
Technical analyses are often done on charts, where various aspects such as support/resistance levels, trendlines, patterns and more are taken into account to draw insightful conclusions about what may come in the future for a particular security. Such evaluations can be invaluable for investors and traders looking to capitalise on emerging opportunities or protect their capital against potential losses.
What Are The Most Common Technical Indicators?
There are a variety of different technical indicators that investors and traders use to gain an edge in the markets. Saxo Capital Markets, a leading multi-asset broker and bank, has identified four critical indicators that traders commonly use– moving averages, volume/trends, relative strength index (RSI) and Bollinger Bands.
Moving Averages: Moving averages help identify trends by smoothing out short-term price fluctuations to show long-term price direction. Short-term moving averages such as ten or 20-day MAs can help traders identify emerging trends earlier than longer-term MAs like 200-day MAs.
Volume/Trends: Volume is the number of shares or contracts traded during a particular period. It can be helpful as it indicates market sentiment and market momentum. Trends are determined by analysing volume, price, and open interest information to identify if there is strong buying or selling activity associated with a stock.
Relative Strength Index (RSI): The RSI measures a security’s relative strength or momentum by comparing its gains over a specified period against its losses over the same period. When looking at the RSI, investors will generally look for readings that are below 30 as indicating potential buy opportunities, while readings above 70 suggest potential sell opportunities.
Bollinger Bands: Bollinger bands are based on moving averages and measure volatility in the market. The bands are typically two standard deviations away from the moving average and can help traders identify breakouts, reversal patterns and changes in volatility.
What Are The Advantages Of Using Technical Indicators?
The advantage of using technical indicators is that they can help traders and investors identify patterns, trends, and potential buy/sell signals faster than manually analysing price data.
Technical analysis can also be used to spot divergences between the performance of a security and the market as a whole. For instance, if the stock market index is moving in one direction, but an individual security chart shows another trend, this could signal an opportunity for a trader or investor to capitalise on before the market catches up.
Lastly, technical indicators allow traders to take emotion out of trading decisions by objectively interpreting price movements through various analytical tools. It helps traders remain disciplined and stick to their strategies when making trades.
How Do Technical Indicators Help You Decide When To Buy Or Sell Stocks?
Technical indicators can help traders and investors identify potential buy and sell signals. For example, when looking at a stock chart, an RSI value below 30 might signal that the security is undervalued or oversold, suggesting a possible buying opportunity. Similarly, if the RSI of security is above 70, it may suggest that the security is becoming overbought –– indicating a potential selling point.
Moving averages are another tool often used by technical analysts to help determine when they should buy/sell securities. When the short-term moving average (10/20 day MA) exceeds the long-term moving average (200 day MA), this may indicate an uptrend, in which case traders may look to buy. Conversely, when the short-term MA crosses below the long-term MA, it could indicate a downtrend and may be a signal to sell.
In addition to these technical indicators, traders use chart patterns such as head and shoulders and double bottoms/tops to help identify potential buy/sell points. Ultimately, traders should use technical and fundamental analysis to determine when they should take action in the markets.


